As you might know Hippo CMS uses Apache Jackrabbit as the core for it’s content repository. One of Jackrabbits features is ‘search’ and the execution of most queries are delegated to Apache Lucene. If you want to keep the queries as fast as possible you sometimes have to analyze how your repository is behaving with the content in your project.
The problem
One of our customers noticed that they had some unexpected memory peaks and slow response times while their system was running during the day. They were using Jackrabbit 2.2.5 at the time. To get some more insight on what was going on we first started out by looking at the server logs. They were using the Jackrabbit search functionality quite heavily, so we replayed the server request logs on the acceptance environment. During the replay we set the log level of the Query to debug, so we were able to see how long each query took. We soon discovered that the longest queries were ‘range queries’ and also noticed that during the execution of such a range query the memory usage reached some peaks.
 |
| User view of a date range |
In this specific case the problamatic queries were date range queries. A date range query is a query that for instance searches for a document between day x and day y.
As an example: Give me all documents that were created between 2007-01-01 and 2011-01-01. This is a very typical search filter, which you will see in all kind of applications.
In plain Jackrabbit a date range query (xpath notation) will look something like this:
//element(*,custom:document)[@custom:date >=xs:dateTime('2007-01-01T00:00:00.000Z')
  and @custom:date <=xs:dateTime('2010-01-01T00:00:00.000Z')] order by @custom:date descending
Now if you would be using the Hippo HST you would have probably used the Filter.addGreaterOrEqualThan and passed along a Date object as an argument, which automatically is being converted into the above syntax.
The analysis
To get some insight in what was causing this behaviour I created a unit test that performed a variety of range queries on a set of 100.000 simple documents/nodes. For this test I created a very simple nodetype definition that would hold a date/date-time property in different kind of formats. The used nodetype looks like this:
[custom:document]
- custom:date (date)
- custom:dateasstringwithhoursandminutesandseconds (string)
- custom:dateasstringwithhoursandminutes (string)
- custom:dateasstring (string)
So looking at the above nodetype definition we have a node that contains 4 properties, where we have a normal JCR date (and time) property and next to that there are 3 properties that have a more fine-grained format of the date-time.
Trying to create a real world scenario the unit test generates documents starting from 01-01-2001. With every new document the test adds 1 hour and 3 seconds to the date field. After creating 100.000 nodes it ends up somewhere around 2012-07-03 03:19:57. The test will then sleeps for about 60 seconds (gives lucene time to finish up it’s indexing) before it starts doing the range queries.
In finding a solution I created 4 different versions of the range query where I start narrowing down on the date format to get closer to the actual date (without the time). In the test case 4 different kind of queries are peformed and repeated 5 times before moving on to the next type of query. The range queries performed are:
- Normal range query (with JCR date-time format like mentioned above)
- Range query with date as string with format yyyyMMddHHmmss
- Range query with date as string with format yyyyMMddHHmm
- Range query with date as string with format yyyyMMdd
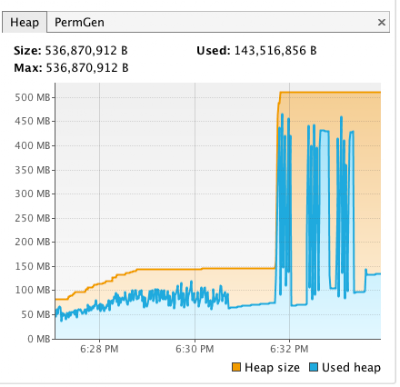
Queries 1 to 3 took an average of 3500 ms (3.5 seconds) with a large memory footprint usage of about 380MB per query. That’s huge and slow for just a simple query! You can imagine this might end up leading to OutOfMemory errors.
 |
| Memory usage overtime while performing the queries (graph comes from VisualVM) |
However the fourth query is actually quite fast and takes less memory! It’s a really significant difference. The fourth query takes about 180 ms on average and uses about 40-50MB. It’s still a lot of memory (in my opinion), but since they are a lot faster the total amount of used memory might not be that large, because the amount of memory is freed much earlier in the process.
Looking at the graph on the right you will see there is no difference between query 1 to 3, but option 4 (which is in fact actually what a date range should do) showed a really large improvement on overall performance and memory usage. So in the end it turns out that the ‘time’ in the default JCR date format was actually giving us the issues. Because the time was added to the date value, the number of unique values for the date property in the lucene index had become larger then needed causing the slowdown.
A solution
Now as a solution we solved this by adding a derived data function that extracts the simplified date property. For range queries we now do the range on the ‘yyyyMMdd’ formatted date and order the results by the original date property, so that the time is taken into account and the sort order is correct. Using the simple date format will also help when trying to find documents/nodes that belong to a certain date. This has just turned into a simple ‘equals’ instead of a range from 0:00 till 23:59:59.
If you are currently using Apache Jackrabbit and are using these kind of queries you might want to rethink you current content model. A small change might give you a huge performance boost!
